Free Images, Photos & Illustrations
Free Image:
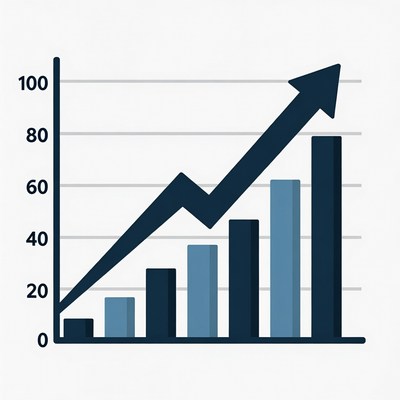
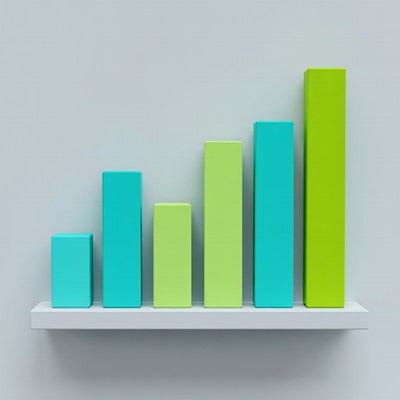
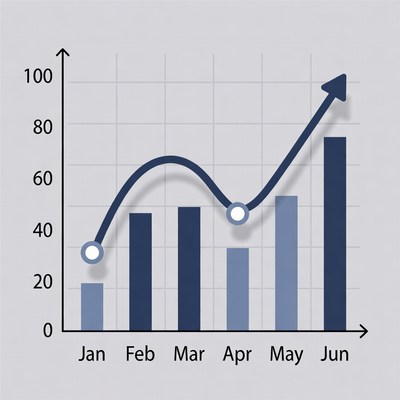
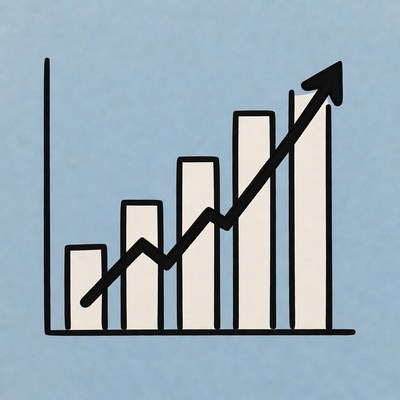
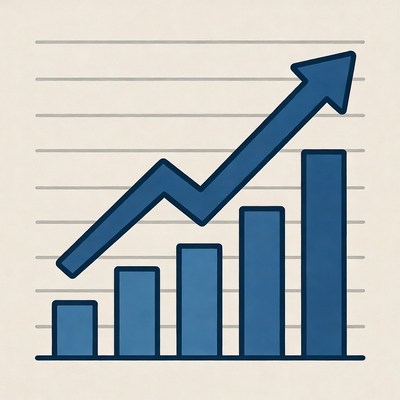
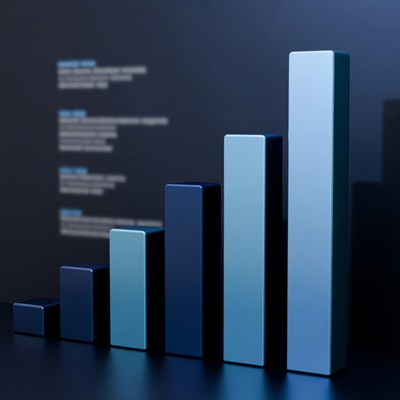
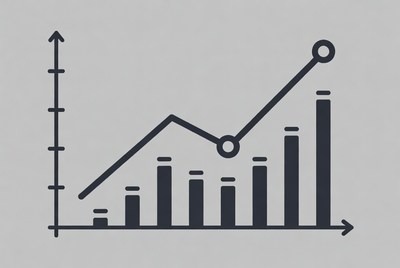
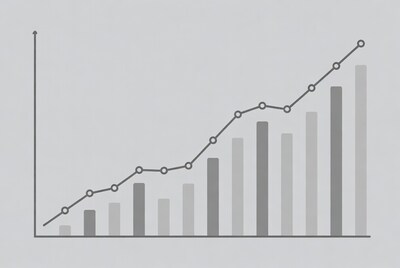
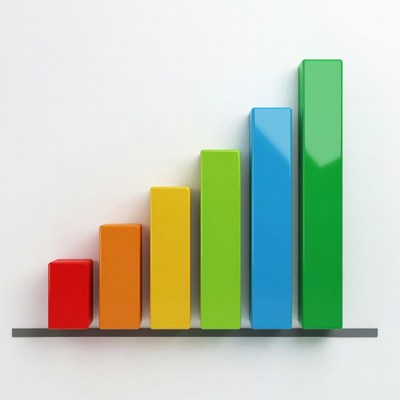
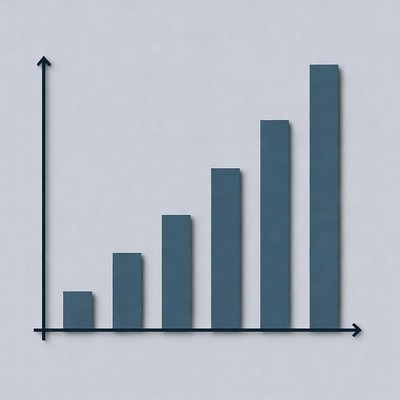
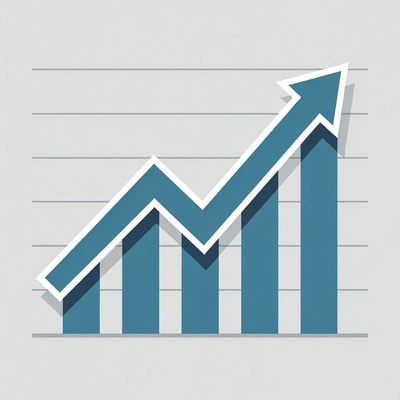
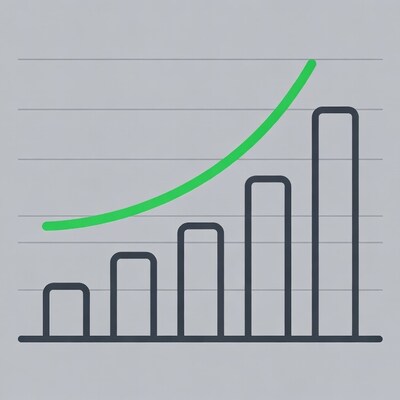
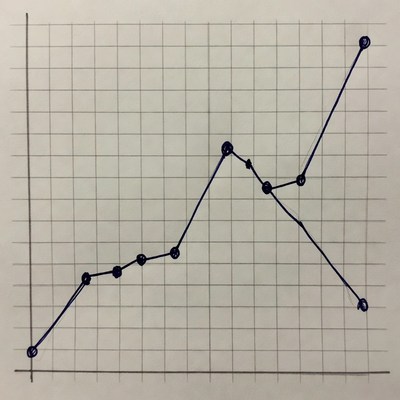
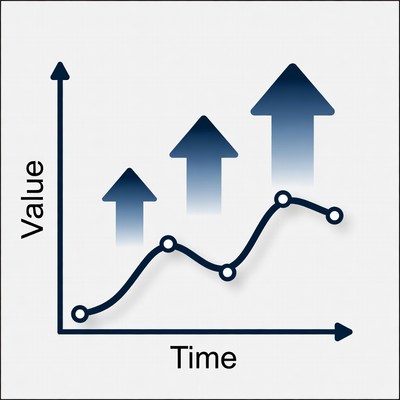
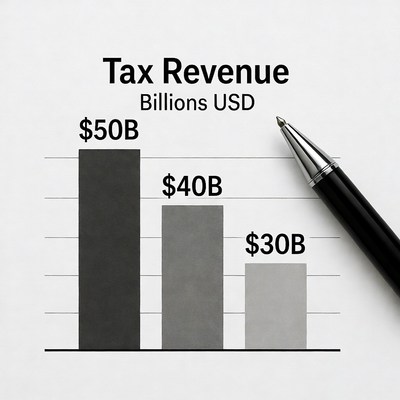
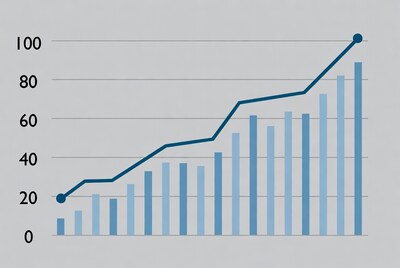
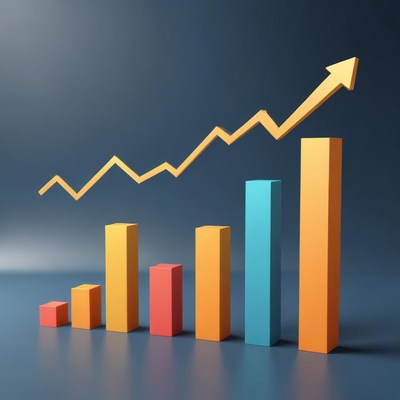
Visualizing growth through a bar chart

Description:
A bar chart displays a clear upward trend in data over time, showcasing growth. Each bar represents values, illustrating progress effectively.
Keywords:
analysis tool, analytics, bars, business metrics, comparison, data analysis, data visualization, financial growth, graphical representation, growth trend, increase, information display, measurement, numerical data, performance analysis, reporting, statistical graph, statistics, upward trend, values
Statistics:
| Added: | November 20, 2025 | |
| Views: | 58 | |
| Downloads: | 0 | |
| Dimensions: | 960 x 960 | |
| Creator: | Ben | |
| Image Generator: | XAI / Grok |
This image is free to use and available under the Creative Commons CC0 1.0 license.
For more information, please review our Image License.
Disclaimer: This image was generated with AI. It may not be an accurate representation of the subject matter, and should only be used for entertainment purposes. Any likenesses to real people, places or things is purely coincidental.
For more information, please review our Image License.
Disclaimer: This image was generated with AI. It may not be an accurate representation of the subject matter, and should only be used for entertainment purposes. Any likenesses to real people, places or things is purely coincidental.


Results: 1 - 96 of 323 total results
