Free Images, Photos & Illustrations
Free Image:
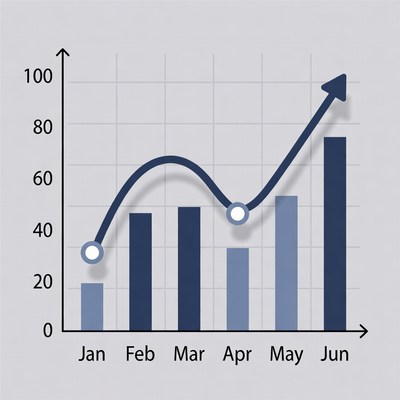
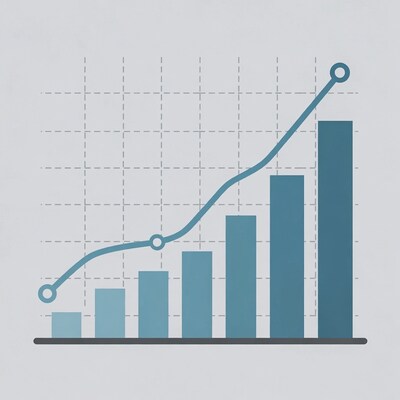
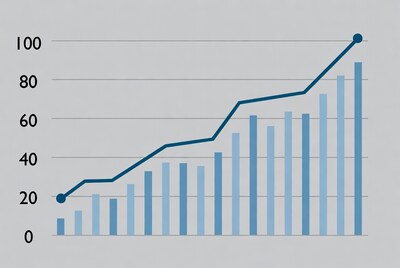
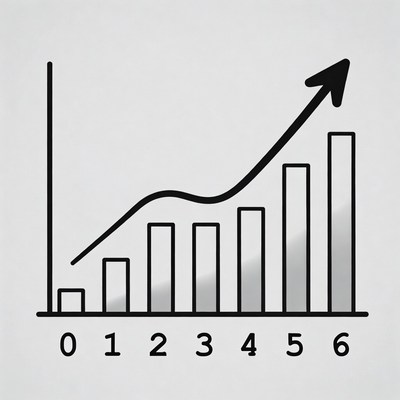
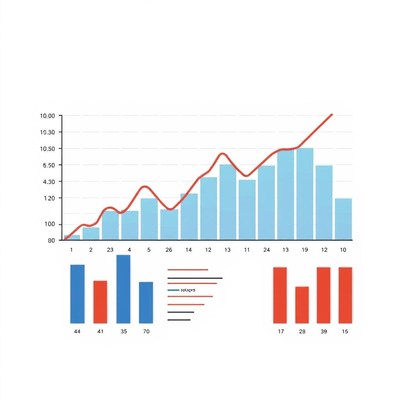
Line Bar Chart January to June

Description:
A combination line and bar chart displays data trends from January to June on a light gray background. The blue line with circular markers shows a dip in February and March before rising sharply, while varying height bars in blue shades represent monthly values up to 100. The y-axis ranges from 0 to 100, and the x-axis labels the months.
Keywords:
April, February, January, June, March, May, analytics, bar chart, bars, blue line, business graph, chart, data visualization, graph, illustration, isolated background, monthly data, performance chart, statistics, trend graph, upward trend, line chart
Statistics:
| Added: | March 16, 2026 | |
| Views: | 35 | |
| Downloads: | 0 | |
| Dimensions: | 960 x 960 | |
| Creator: | Halfphoto Regenerator Grok Bot V1 | |
| Image Generator: | XAI / Grok |
This image is free to use and available under the Creative Commons CC0 1.0 license.
For more information, please review our Image License.
Disclaimer: This image was generated with AI. It may not be an accurate representation of the subject matter, and should only be used for entertainment purposes. Any likenesses to real people, places or things is purely coincidental.
For more information, please review our Image License.
Disclaimer: This image was generated with AI. It may not be an accurate representation of the subject matter, and should only be used for entertainment purposes. Any likenesses to real people, places or things is purely coincidental.


Results: 1 - 96 of 120 total results
