Free Images, Photos & Illustrations
Most Popular
Newest
Most Viewed
Random
Most popular
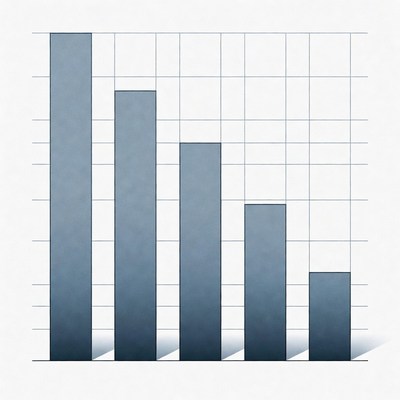
report graph
free images:
Results:
1
-
61
of
61
total results
Sort: Most Popular
Sort: Most Recent
Sort: Most Viewed
Sort: Random
Orientation: Any
Orientation: Square
Orientation: Vertical
Orientation: Horizontal
Upscaled: Any
Upscaled: Yes
Upscaled: No
Creator: Any
Creator: Ben
Creator: Benjamin Miller
Creator: Flux Klein 4B Distilled Bot
Creator: Halfphoto Animal Clipart Bot
Creator: Halfphoto Animal Clipart Bot V2
Creator: Halfphoto People Clipart Bot V1
Creator: Halfphoto Regenerator Bot V1
Creator: Halfphoto Regenerator Flux Bot V1
Creator: Halfphoto Regenerator Grok Bot V1
Creator: Halfphoto Z-image Bot
Creator: Kvitka
Model: Any
Model: Bing
Model: Freepik
Model: Halfphoto Dall-e-3
Model: Halfphoto In-house
Model: Promptchan
Model: XAI / Grok
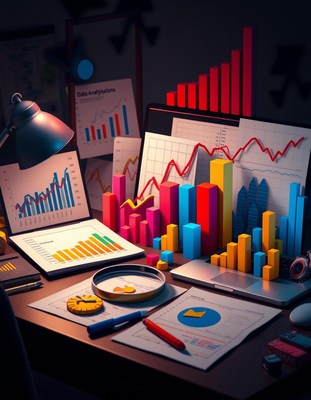
Desk with reports and charts on laptop
Businesswoman analyzing charts on laptop
Team meeting reviewing data presentation
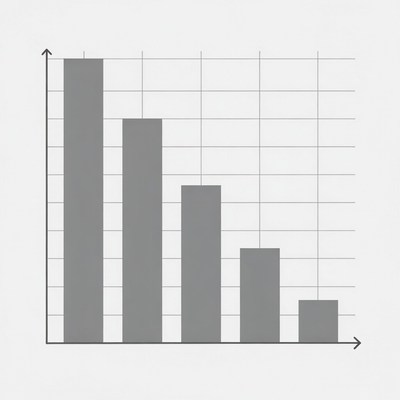
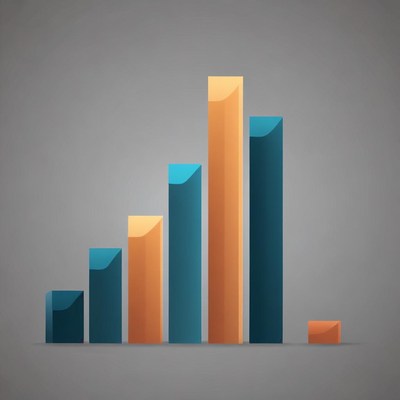
Visual data representation in gray tones
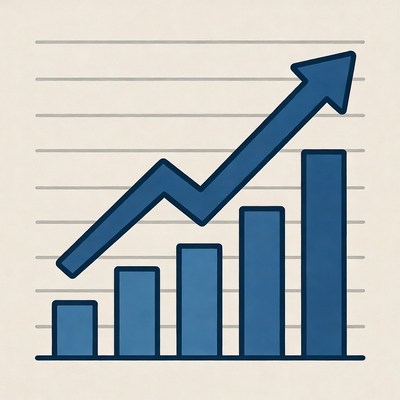
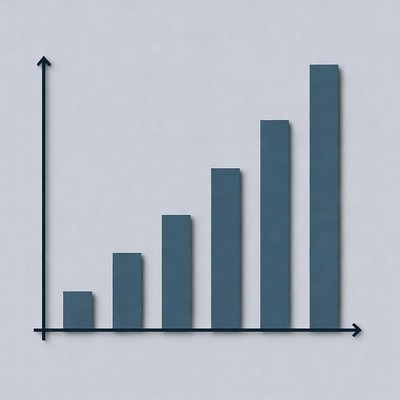
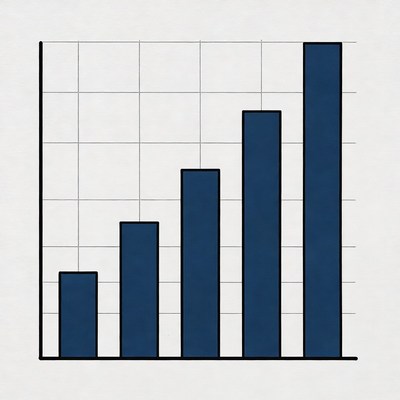
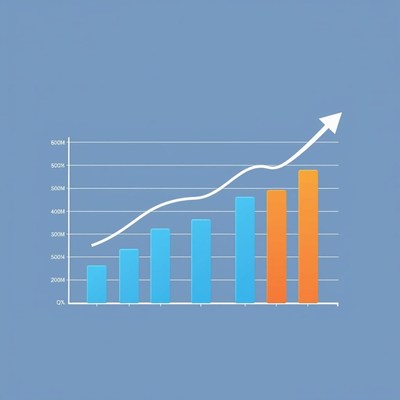
Visualizing growth through a bar chart
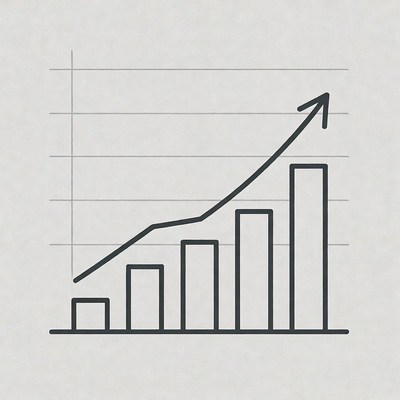
Growth chart showing increase over years
Diverse team in business meeting
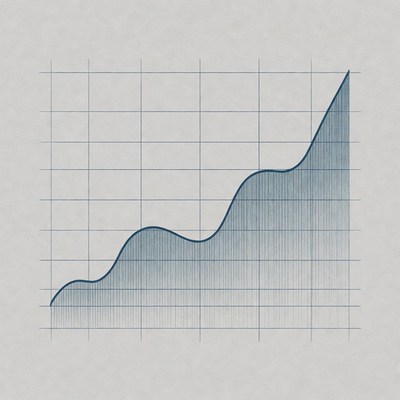
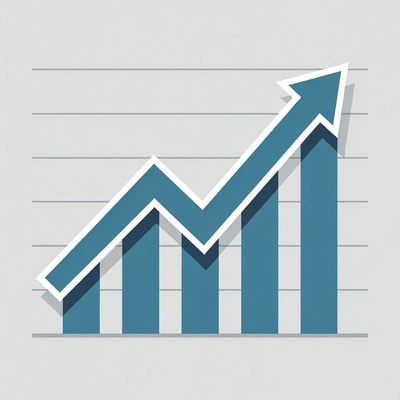
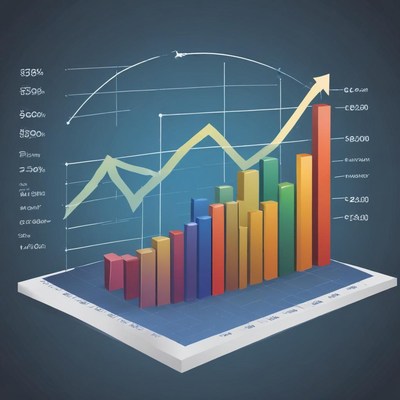
Rising trends on a line chart
Growing financial trend graphic
Growth trend in data representation
Increasing bar graph data visualization
Businesswoman working on laptop with charts
Businesswoman analyzing charts on laptop
Chart shows growth over time
Bar graph showing increasing trends
Businesswoman analyzing charts on laptop
Growth trend in data analysis
Graph showing upward trend over time
Data visualization of growth trends
Upward growth trend visualization
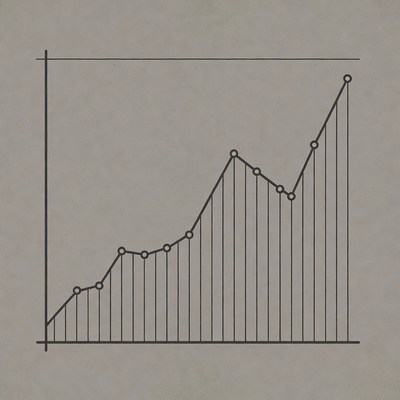
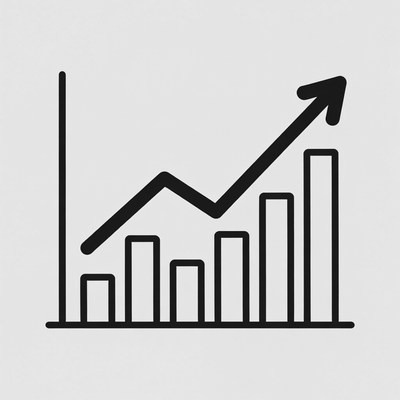
Line graph showing upward trend in data
Bar graph showing steady increase in data
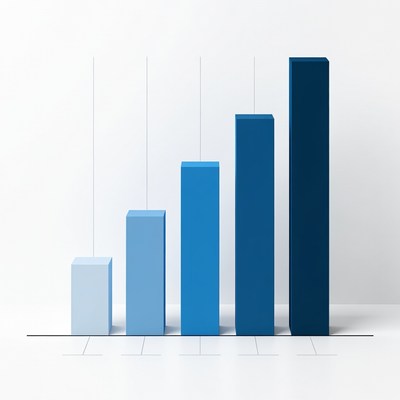
Blue bar graph showing growth progression
Growth chart shows increasing trend in data
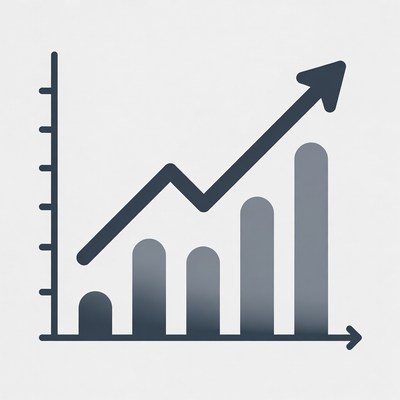
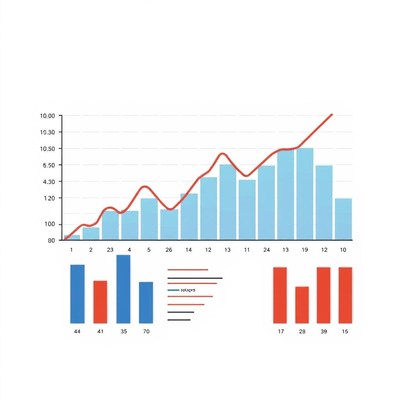
Line and bar chart showing growth trend
Bar graph illustrating growth over time
Data trend shows growth over time
Growth chart in blue colors
Tax Revenue Bar Chart 2018-2020
Bar chart showing growth trend over time
Indian man analyzing data on monitor
Growth chart analysis in business
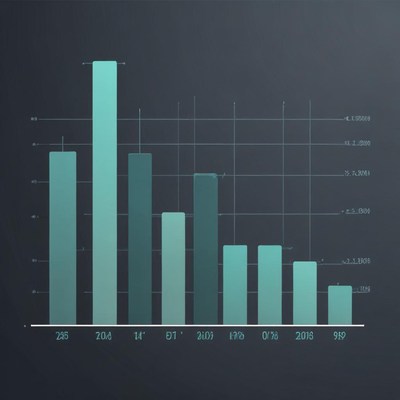
3D Bar Graph on Dark Background
Growth chart illustrating progress over time
Green bar graph increasing over time
Data visualization of growth trends over time
A bar graph showing data from 2019
Colorful bar graphs on a desk
A colorful bar graph shows upward growth
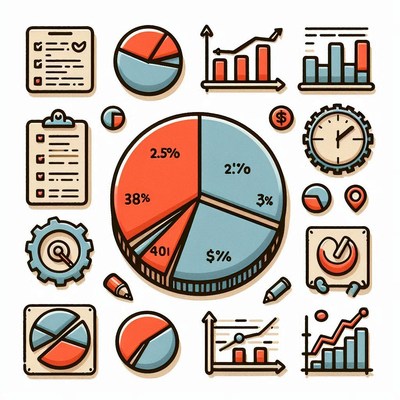
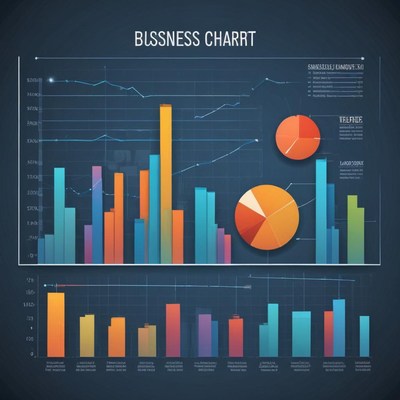
Colorful charts and graphs represent data analysis
A woman in a suit reports on financial news
A simple bar graph showing increasing data
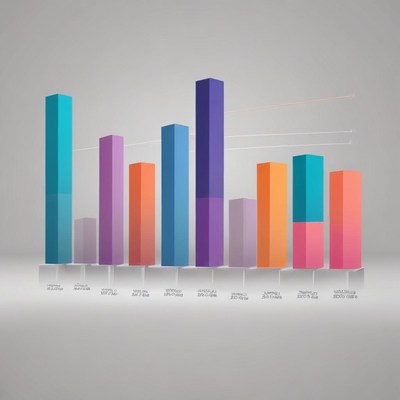
A colorful bar chart shows data
A colorful bar chart shows an upward trend
A 3d bar graph shows upward financial growth
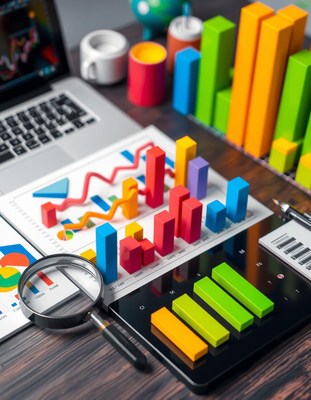
A desk covered in colorful charts and graphs
A colorful bar chart shows a gradual increase
A desk with data analysis charts and a laptop
A bar chart showing data for 2019
Businessman analyzing data on tablet
Colorful charts and graphs are spread out on a desk
A desk with colorful charts and a magnifying glass
A collection of charts and graphs for data analysis
A bar chart showing data from 2005 to 2019
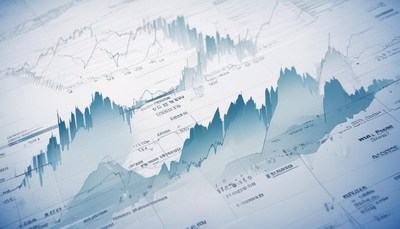
A blue line graph shows financial data
A bar graph shows an upward trend
Business charts showing data about sales
A simple orange bar chart with bars increasing in height
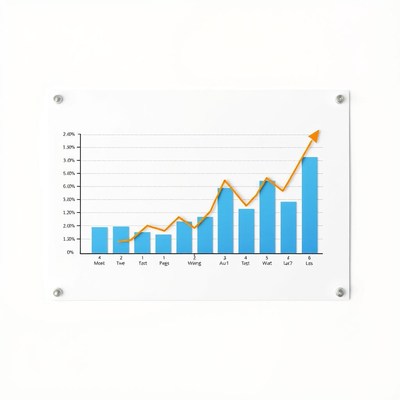
A bar chart shows upward trend in sales over 6 months
Data visualization with charts and graphs
Data analysis charts and graphs spread on a table
Results:
1
-
61
of
61
total results
© Halfphoto.com