Free Images, Photos & Illustrations
Free Image:
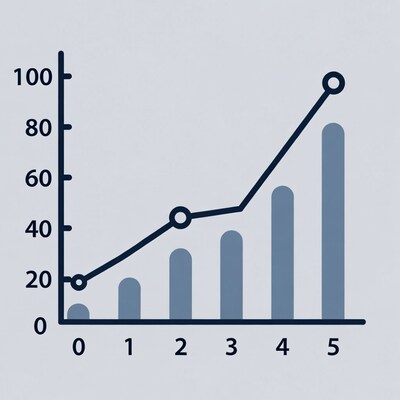
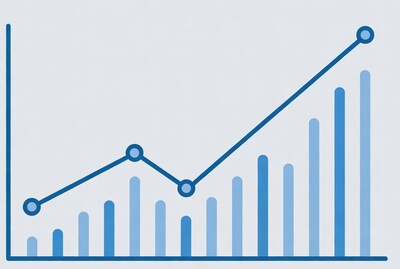
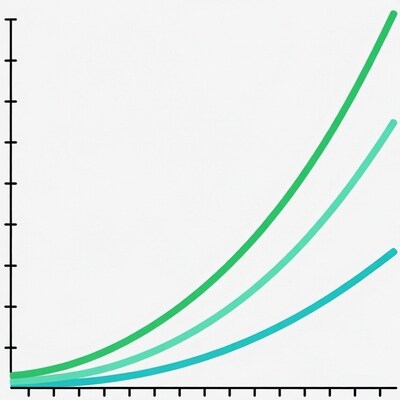
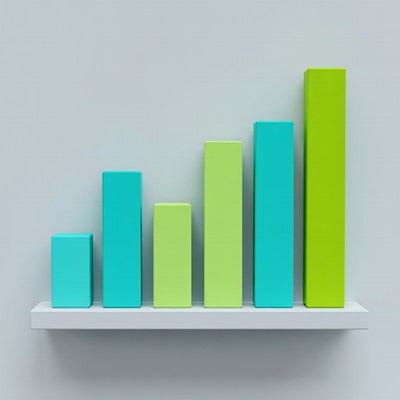
Colorful charts and graphs represent data analysis

Description:
3D charts and graphs on a table with a magnifying glass and a calculator.
Keywords:
analysis, analytics, bar, business, chart, data, financial, graph, growth, infographic, line, marketing, pie, presentation, report, research, statistics, strategy, trend, visualization
Statistics:
| Added: | August 13, 2024 | |
| Views: | 32 | |
| Downloads: | 0 | |
| Dimensions: | 1024 x 1024 | |
| Creator: | Kvitka | |
| Image Generator: | Bing |
This image is free to use and available under the Creative Commons CC0 1.0 license.
For more information, please review our Image License.
Disclaimer: This image was generated with AI. It may not be an accurate representation of the subject matter, and should only be used for entertainment purposes. Any likenesses to real people, places or things is purely coincidental.
For more information, please review our Image License.
Disclaimer: This image was generated with AI. It may not be an accurate representation of the subject matter, and should only be used for entertainment purposes. Any likenesses to real people, places or things is purely coincidental.


Results: 1 - 96 of 1,072 total results
