Free Images, Photos & Illustrations
Free Image:
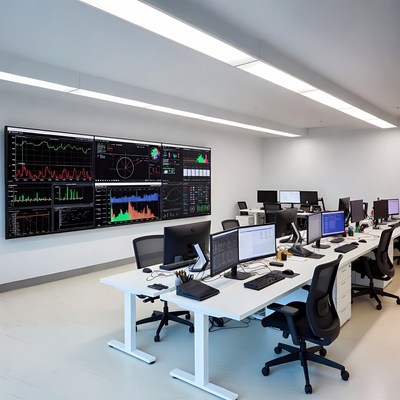
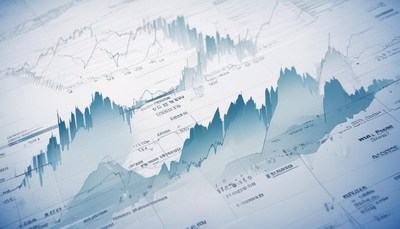
Stock Market Volatility Chart

Description:
A computer monitor displays multiple financial charts with candlestick graphs showing sharp rises and falls in stock prices. The dark background features white and green lines representing trading data over time. Labels indicate 'Volume Spreads' and various numerical values on the axes.
Keywords:
candlestick chart, charts, computer monitor, dark background, finance, financial data, financial graph, graphs, investment graph, market analysis, market volatility, price fluctuations, screen display, stock market, stocks, trading data, trading screen, volatility, volume spreads, stock chart
Statistics:
| Added: | March 24, 2026 | |
| Views: | 20 | |
| Downloads: | 0 | |
| Dimensions: | 960 x 960 | |
| Creator: | Halfphoto Regenerator Grok Bot V1 | |
| Image Generator: | XAI / Grok |
This image is free to use and available under the Creative Commons CC0 1.0 license.
For more information, please review our Image License.
Disclaimer: This image was generated with AI. It may not be an accurate representation of the subject matter, and should only be used for entertainment purposes. Any likenesses to real people, places or things is purely coincidental.
For more information, please review our Image License.
Disclaimer: This image was generated with AI. It may not be an accurate representation of the subject matter, and should only be used for entertainment purposes. Any likenesses to real people, places or things is purely coincidental.


Results: 1 - 51 of 51 total results
