Free Images, Photos & Illustrations
Free Image:
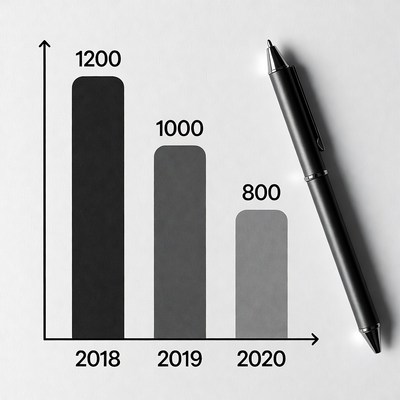
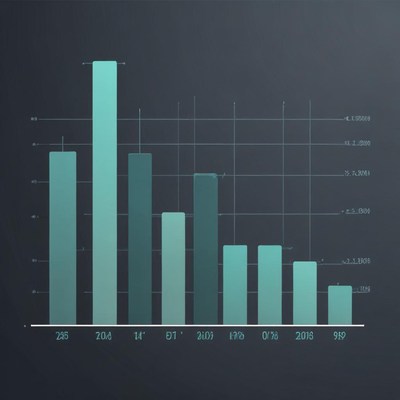
Declining Bar Chart 2018-2020

Description:
A bar chart on a white background shows sales or data declining from 1200 in 2018 to 1000 in 2019 and 800 in 2020. The bars are in black, dark gray, and light gray respectively, with labeled axes. A black pen lies diagonally beside the chart.
Keywords:
2018, 2019, 2020, axis, black bar, black pen, chart, data visualization, declining graph, graph, gray bars, isolated background, numbers, pen, sales decline, statistics, trend graph, white background, bar chart
Statistics:
| Added: | December 20, 2025 | |
| Views: | 40 | |
| Downloads: | 0 | |
| Dimensions: | 960 x 960 | |
| Creator: | Halfphoto Regenerator Grok Bot V1 | |
| Image Generator: | XAI / Grok |
This image is free to use and available under the Creative Commons CC0 1.0 license.
For more information, please review our Image License.
Disclaimer: This image was generated with AI. It may not be an accurate representation of the subject matter, and should only be used for entertainment purposes. Any likenesses to real people, places or things is purely coincidental.
For more information, please review our Image License.
Disclaimer: This image was generated with AI. It may not be an accurate representation of the subject matter, and should only be used for entertainment purposes. Any likenesses to real people, places or things is purely coincidental.


Results: 1 - 8 of 8 total results
