Free Images, Photos & Illustrations
Most Popular
Newest
Most Viewed
Random
Most popular
report
free images:
Results:
1
-
96
of
127
total results
Sort: Most Popular
Sort: Most Recent
Sort: Most Viewed
Sort: Random
Orientation: Any
Orientation: Square
Orientation: Vertical
Orientation: Horizontal
Upscaled: Any
Upscaled: Yes
Upscaled: No
Creator: Any
Creator: Ben
Creator: Benjamin Miller
Creator: Flux Klein 4B Distilled Bot
Creator: Halfphoto Animal Clipart Bot
Creator: Halfphoto Animal Clipart Bot V2
Creator: Halfphoto People Clipart Bot V1
Creator: Halfphoto Regenerator Bot V1
Creator: Halfphoto Regenerator Flux Bot V1
Creator: Halfphoto Regenerator Grok Bot V1
Creator: Halfphoto Z-image Bot
Creator: Kvitka
Model: Any
Model: Bing
Model: Freepik
Model: Halfphoto Dall-e-3
Model: Halfphoto In-house
Model: Promptchan
Model: XAI / Grok
Group discussing data in meeting
Blank clipboard ready for notes
Desk with reports and charts on laptop
Businesswoman analyzing charts on laptop
Analyst reviews market data displays
Team meeting reviewing data presentation
City council meeting weather update
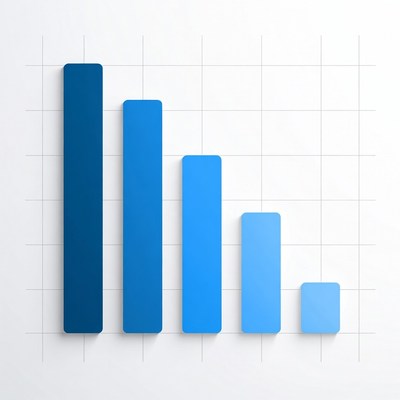
Declining trend shown in data visualization
Visual data representation in gray tones
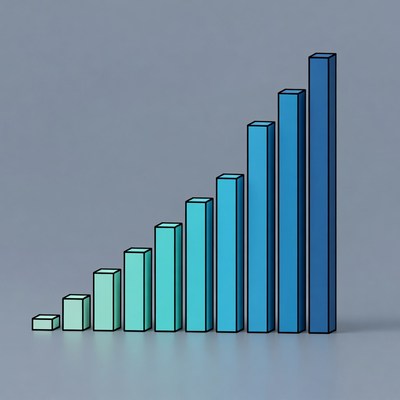
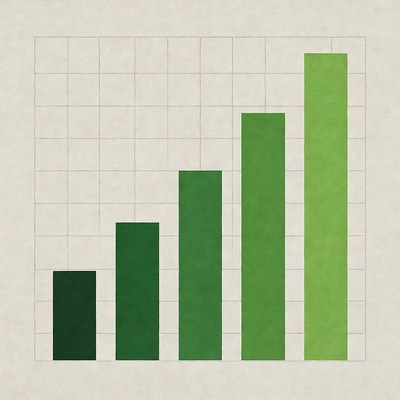
Visualizing growth through a bar chart
Growth chart showing increase over years
Diverse team in business meeting
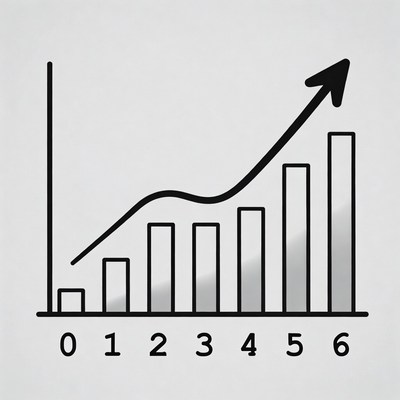
Rising trends on a line chart
Growing financial trend graphic
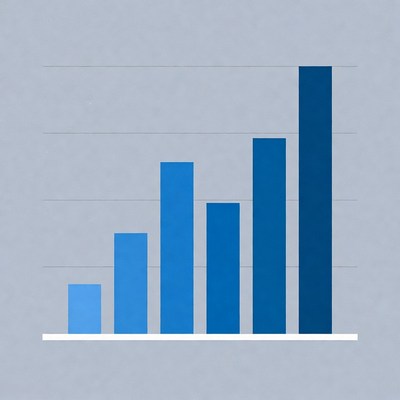
Growth trend in blue bars
Visual representation of growth trends
Increasing bar graph data visualization
Businesswoman working on laptop with charts
Businesswoman analyzing charts on laptop
Chart shows growth over time
Bar graph showing increasing trends
Growth trend in data representation
Data growth on blue bars
Businesswoman holding a planner in office
Blank clipboard on a wall
News anchors present breaking news live
Businesswoman analyzing charts on laptop
Growth trend in data analysis
Graph showing upward trend over time
Growth chart with upward trend
Data visualization of growth trends
Upward growth trend visualization
Calculator on stock market data
Line graph showing upward trend in data
Doctor reading patient report in hospital
Bar graph showing steady increase in data
Blue bar graph showing growth progression
Growth chart shows increasing trend in data
Growth chart with rising trend lines
Business growth trend illustration
Line and bar chart showing growth trend
Growth chart showing data trends and analysis
News presenters at studio desk
Bar graph illustrating growth over time
Data trend shows growth over time
News anchor reports on stock market
Live news report from a newsroom
Growth chart in blue colors
Filming wildfire in open field
Doctor reads patient report in clinic
Doctor reviewing patient report in clinic
Tax Revenue Bar Chart 2018-2020
Doctor reviewing patient chart in clinic
Healthcare worker reviews patient information
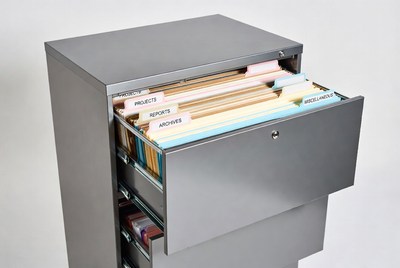
Open gray filing cabinet drawers
News anchors present live broadcast update
News anchors deliver breaking updates live
News anchors present breaking news update
Bar chart showing growth trend over time
Growth chart showing upward trend
Indian man analyzing data on monitor
Yellow Sticky Note To-Do List
Broadcast team reporting live news
A man in a suit sits at a desk in an office
News anchors presenting live updates
Live news broadcast on current events
Breaking news broadcast in progress
News anchors presenting breaking updates
News anchors delivering breaking updates
Growth chart analysis in business
Project Management Workflow Diagram
News anchors present emergency update
News anchors present breaking news update
Doctor reading medical report in clinic
Red A Grade Stamp on Paper
News anchors present live update
Breaking news update from the studio
News anchors reporting live update
Live news broadcast from the studio
Live news broadcast from the studio
Anchors report breaking news update
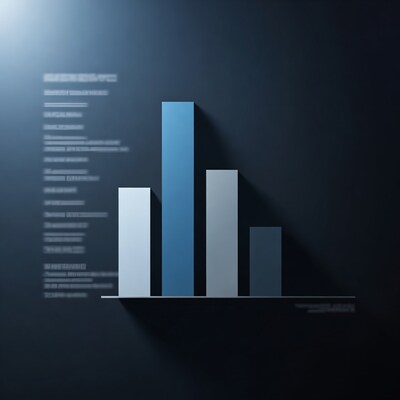
3D Bar Graph on Dark Background
Live breaking news update broadcast
News anchors delivering breaking story
News anchors report breaking news story
Growth chart illustrating progress over time
News anchor team presents nightly news
News anchors report breaking updates live
News anchors presenting breaking news update
Green bar graph increasing over time
Live breaking news coverage from the studio
Doctor reviewing patient information in clinic
Police Gun Badge Handcuffs Bullets
Police Gear with Gun Badge Handcuffs Report
Data visualization of growth trends over time
A bar graph showing data from 2019
Results:
1
-
96
of
127
total results
Next
© Halfphoto.com