Free Images, Photos & Illustrations
Most Popular
Newest
Most Viewed
Random
Most popular
line graph
free images:
Results:
1
-
96
of
219
total results
Sort: Most Popular
Sort: Most Recent
Sort: Most Viewed
Sort: Random
Orientation: Any
Orientation: Square
Orientation: Vertical
Orientation: Horizontal
Upscaled: Any
Upscaled: Yes
Upscaled: No
Creator: Any
Creator: Ben
Creator: Benjamin Miller
Creator: Flux Klein 4B Distilled Bot
Creator: Halfphoto Animal Clipart Bot
Creator: Halfphoto Animal Clipart Bot V2
Creator: Halfphoto People Clipart Bot V1
Creator: Halfphoto Regenerator Bot V1
Creator: Halfphoto Regenerator Flux Bot V1
Creator: Halfphoto Regenerator Grok Bot V1
Creator: Halfphoto Z-image Bot
Creator: Kvitka
Model: Any
Model: Bing
Model: Freepik
Model: Halfphoto Dall-e-3
Model: Halfphoto In-house
Model: Promptchan
Model: XAI / Grok
Business team discussing charts in meeting
Green upward trend graph arrow
Business and productivity icons set
Colorful Pie Bar Chart Icons
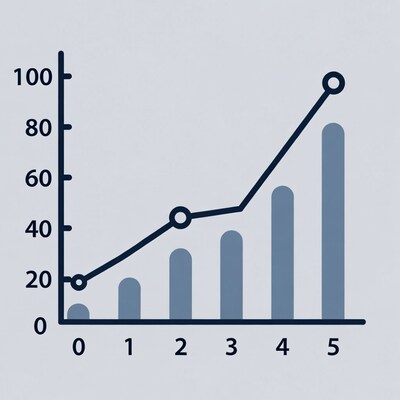
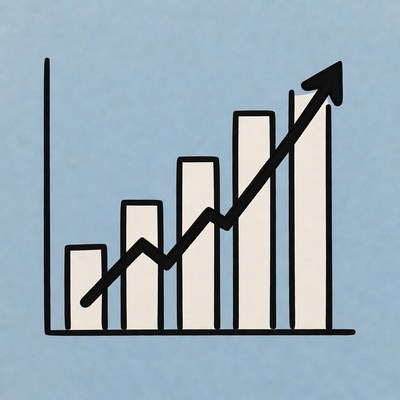
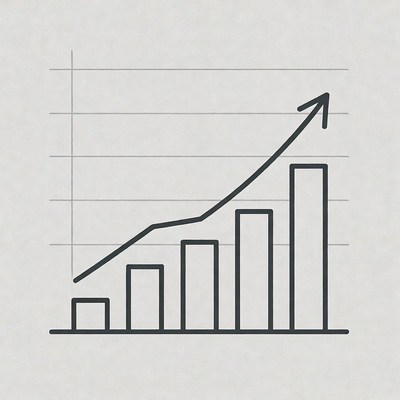
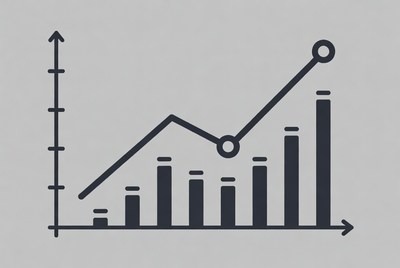
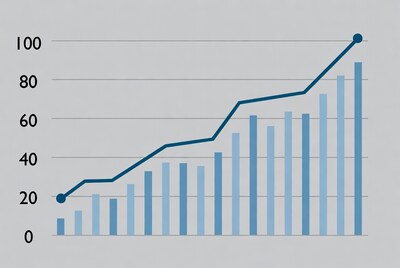
Bar and line chart growth
Data analysis on a wooden desk
Rising Light Bulbs Growth Chart
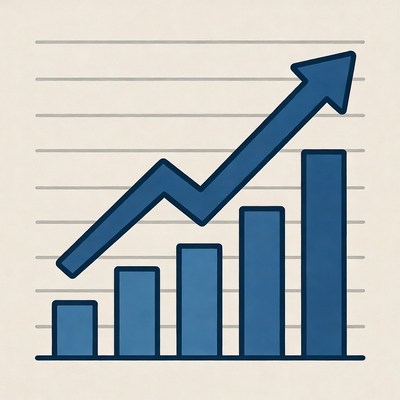
Blue Bar Graph with Upward Yellow Arrow
Business team discussing charts at whiteboard
Green upward arrow graph
Green upward arrow graph
Asian woman presenting charts to diverse business meeting
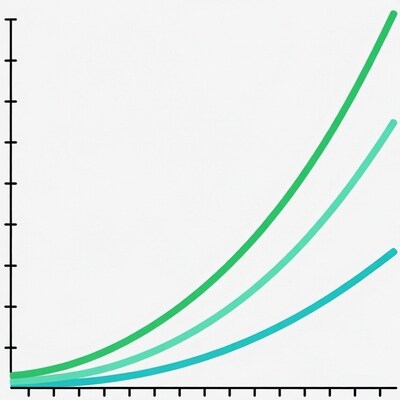
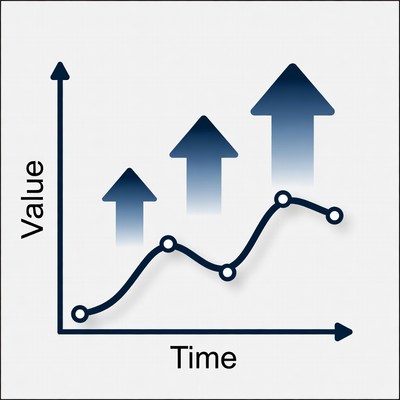
Multiple Upward Trending Lines Graph
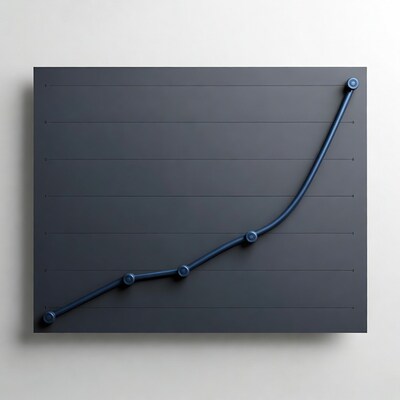
Blue upward trend line chart
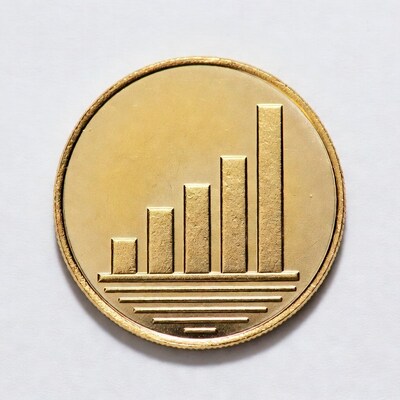
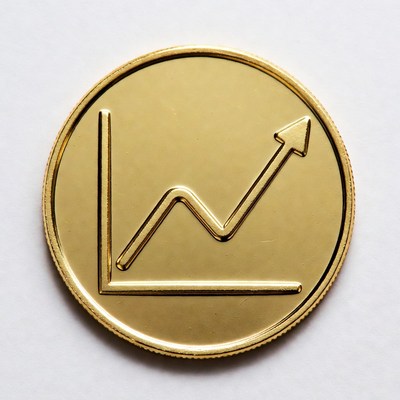
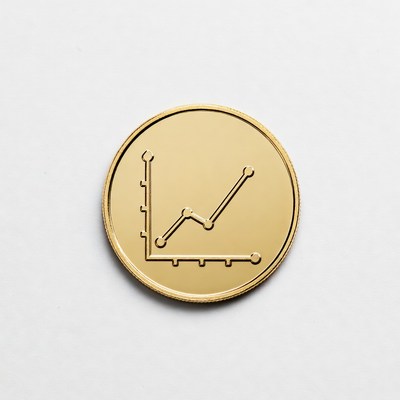
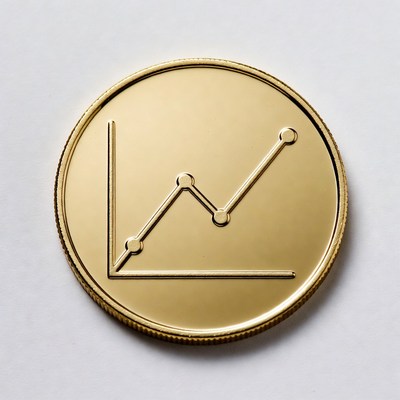
Gold Coin with Rising Bar Graph
Businesswoman presenting charts to team
Diverse team in business meeting presentation
African-American woman presenting charts to business team
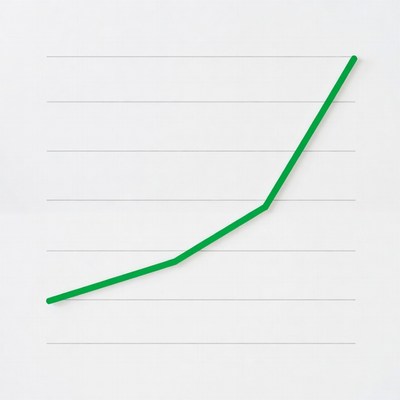
Green Upward Trend Line Graph
Golden Arrow on Money Stacks
White upward arrow on dark background
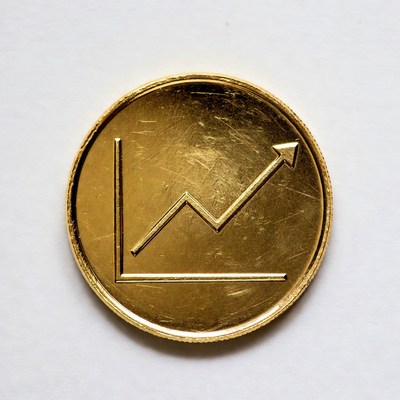
Gold coin with upward trend chart
Business team meeting with charts
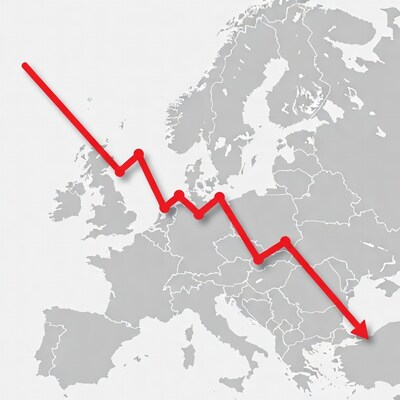
Declining Red Line Across Europe Map
Blank Graph Paper Sticky Note
Businessman and woman discussing charts
Green Upward Trend Line Graph
Young man in lab coat analyzing charts
Blue upward trend line graph
Green upward trend line graph
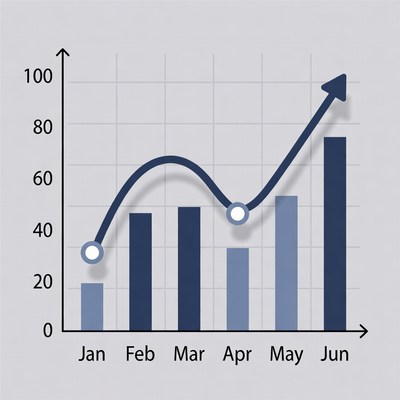
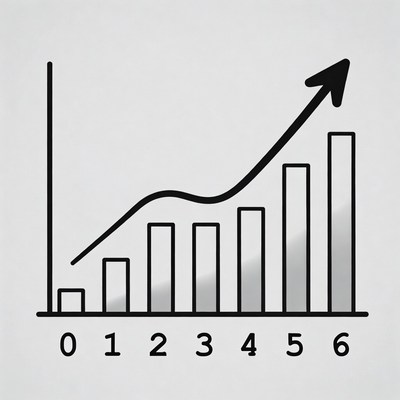
Line Bar Chart January to June
Neon City Skyline with Stock Market Crash
Growth chart showing increase over years
Green Upward Trend Graph
Graphic Design Icons Set
Businesswoman climbing success graph
Business team reviewing charts in meeting
UK Map with Red Downward Arrow
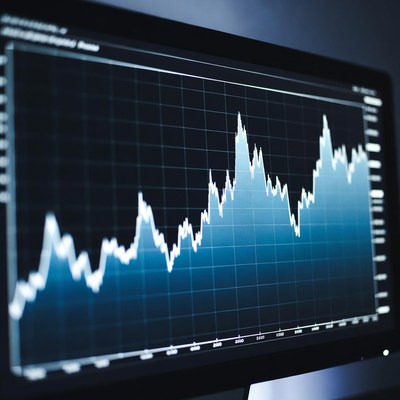
Stock Market Chart on Monitor
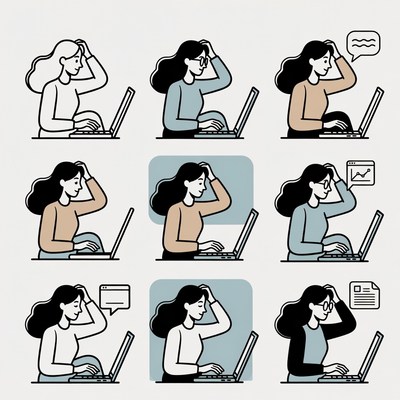
Woman working on laptop illustrations
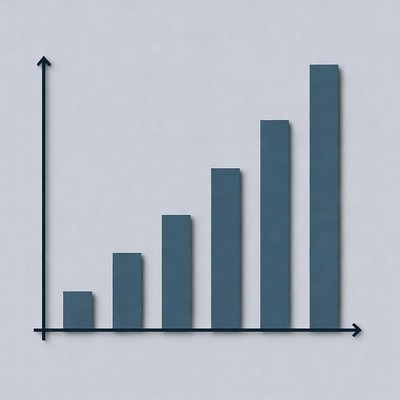
Upward Trend Bar Graph
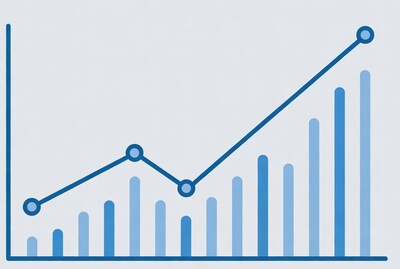
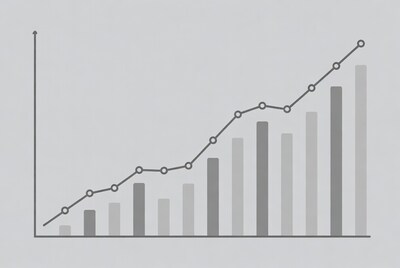
Blue Line Graph with Bars
Golden Coin with Upward Graph
Rising trends on a line chart
Chart shows growth over time
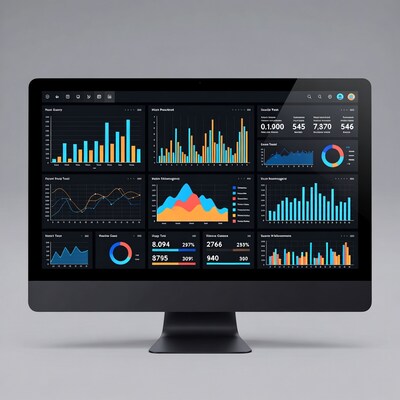
Dark Dashboard on Computer Monitor
Growth trend in data representation
SOMOM 044 House Icon
Gold Coin with Upward Trend Graph
White grid paper with TXT label
Green upward arrow graph
Green ECG Heartbeat Line
3D upward trend graph
Upward Trend Line Graph
Upward Line Graph with Bar Chart
Growth trend in data analysis
Green Line Chart with Rising Bars
African-American woman presenting charts to audience
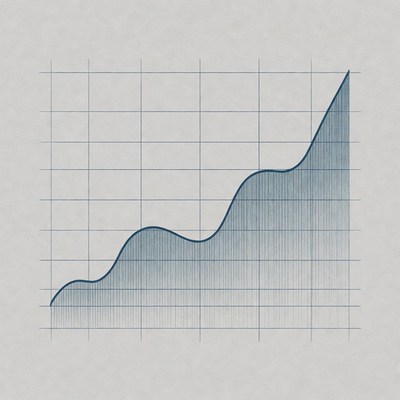
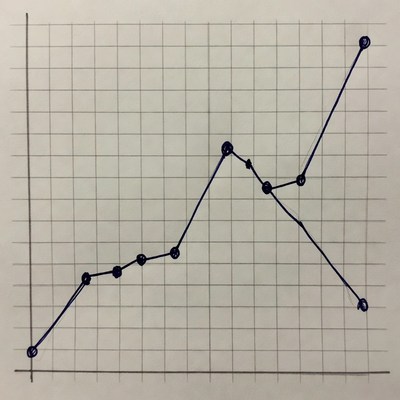
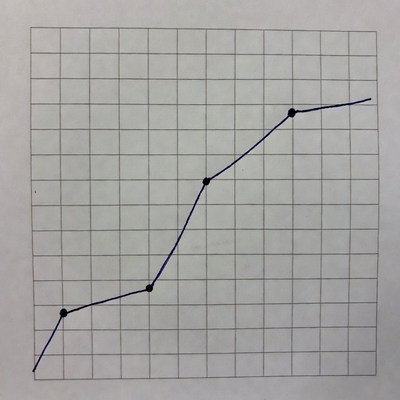
Line Graph on Grid Background
Colorful Business Icon Set
Rising Value Trend Graph
Browser Window with Bar Chart Icon
Man presenting chart to audience
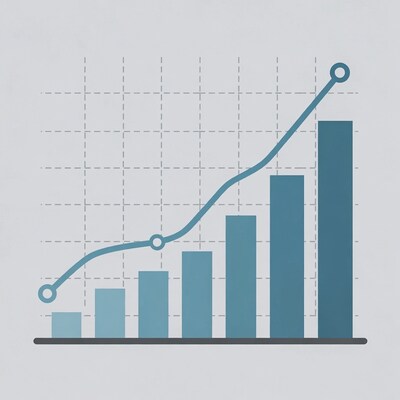
Blue Bar Graph with Rising Line Chart
Asian man holding digital globe
Blue line graph on paper
Golden Bitcoin with city skyline and charts
Line graph showing upward trend in data
Colorful Bar Chart Pie Chart Line Graph
Glowing Network Nodes on Dark Background
Upward Gray Bar Graph
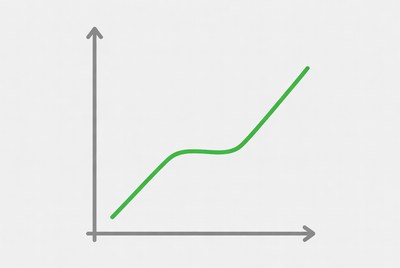
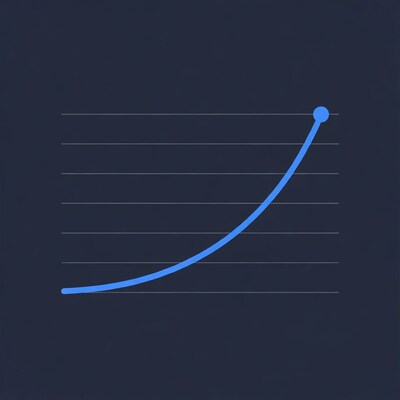
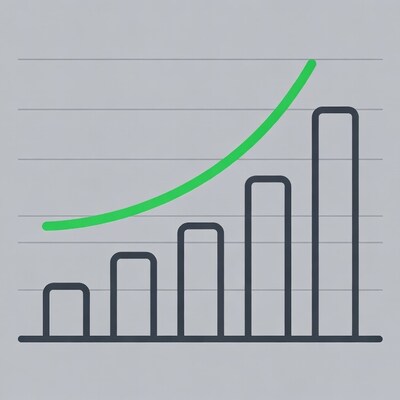
Green Upward Curve Graph
ECG Monitor Lead II Heartbeat
Gold Coin with Upward Graph
Gold Coin with Upward Graph
Economy Gear with Charts and Graphs
Financial Charts on World Map
Gears Money and Growth Chart Illustration
Blue Upward Trend Graph
Man holding glowing digital globe
Line and bar chart showing growth trend
Growth chart shows increasing trend in data
Blue upward trend line graph
Declining Trend Line on UK Map
Bar Graph on Screen Icon
Gold Coin with Upward Graph
Gold Coin with Upward Trend Graph
Gold Coin with Upward Graph Arrow
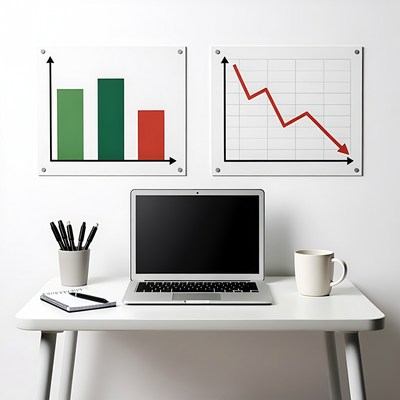
Office desk with charts and laptop
Upward Trending Arrow Graph
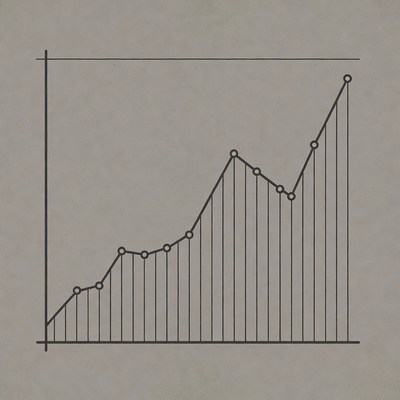
Upward Line Graph on Grid
Data trend shows growth over time
Open notebook with financial charts city skyline
Red Downward Arrow Graph on World Map
Businesswoman pushing upward arrow graph
Colorful Rising Bar Graph on Shelf
Results:
1
-
96
of
219
total results
Next
© Halfphoto.com